Practical Latency Troubleshooting: A Layer-by-Layer Guide
When response times spike, how do you find the bottleneck? Walk through a systematic approach using HTTP timing fractions, TCP metrics, server headers, and percentile analysis to isolate whether the problem is on the network, the CDN, or the origin.
Your monitoring fires an alert: response times jumped from 150 ms to 1.2 seconds. The question isn’t whether something is slow — it’s where the slowness lives. Is it the origin server? The CDN edge? The network path between the client and the first hop? Each points to a completely different fix.
This guide walks through a systematic, layer-by-layer approach to isolating latency. We’ll use HTTP timing fractions, TCP-level metrics, server-side headers, and percentile analysis — all of which Oack captures automatically.
The request path
Before diving into metrics, let’s establish the full path a request takes. Every HTTP request from an Oack network tester traverses up to four layers, and each layer can contribute its own latency — and its own observability signals.
Each layer adds headers on the response path. Reading them from right to left tells you where time was spent:
| Layer | Headers / signals |
|---|---|
| Client (Oack tester) | dns_ms, connect_ms (TCP handshake), tls_ms, send_ms, wait_ms (TTFB), receive_ms — plus TCP: rtt, retransmits, cwnd, rto |
| CDN Edge | cf-cache-status, server-timing: cfL4;dur=…, x-cdn-timing, age |
| SLB / Ingress | server-timing: upstream;dur=…, x-upstream-time, x-request-time * |
| Upstream | server-timing: app;dur=…, db;dur=…, x-runtime |
* x-request-time in headers ≠ true total time — see note below.
- Upstream can add
Server-Timing: app;dur=12, db;dur=8to report how long its own processing took. - SLB (Nginx, HAProxy, etc.) can add upstream connect and response time. Nginx’s
$upstream_response_timeand$request_timeare the most common. - CDN adds cache status, edge timing, and sometimes a full timing breakdown of the origin fetch.
- The client (Oack’s network tester) independently measures every fraction: DNS, TCP connect, TLS handshake, send, wait (TTFB), and receive — plus kernel-level TCP statistics.
A note on Nginx $request_time in headers
If your Nginx config injects $request_time into a response header (e.g. add_header X-Request-Time $request_time), the value is not the true total time. Here’s why: Nginx writes response headers before streaming the response body. The $request_time variable is evaluated at header-write time, so it captures the time from request receipt up to the point where headers are flushed — it does not include the time spent transmitting the body to the client.
The real total time is only available in the Nginx access log, where $request_time is evaluated after the connection is closed. If accurate total time matters (and for large responses it absolutely does), read it from logs, not headers.
Step 1: Establish a baseline with percentiles
Before chasing a root cause, you need to know whether the current values are actually abnormal. A 200 ms wait time might be catastrophic for one endpoint and perfectly typical for another.
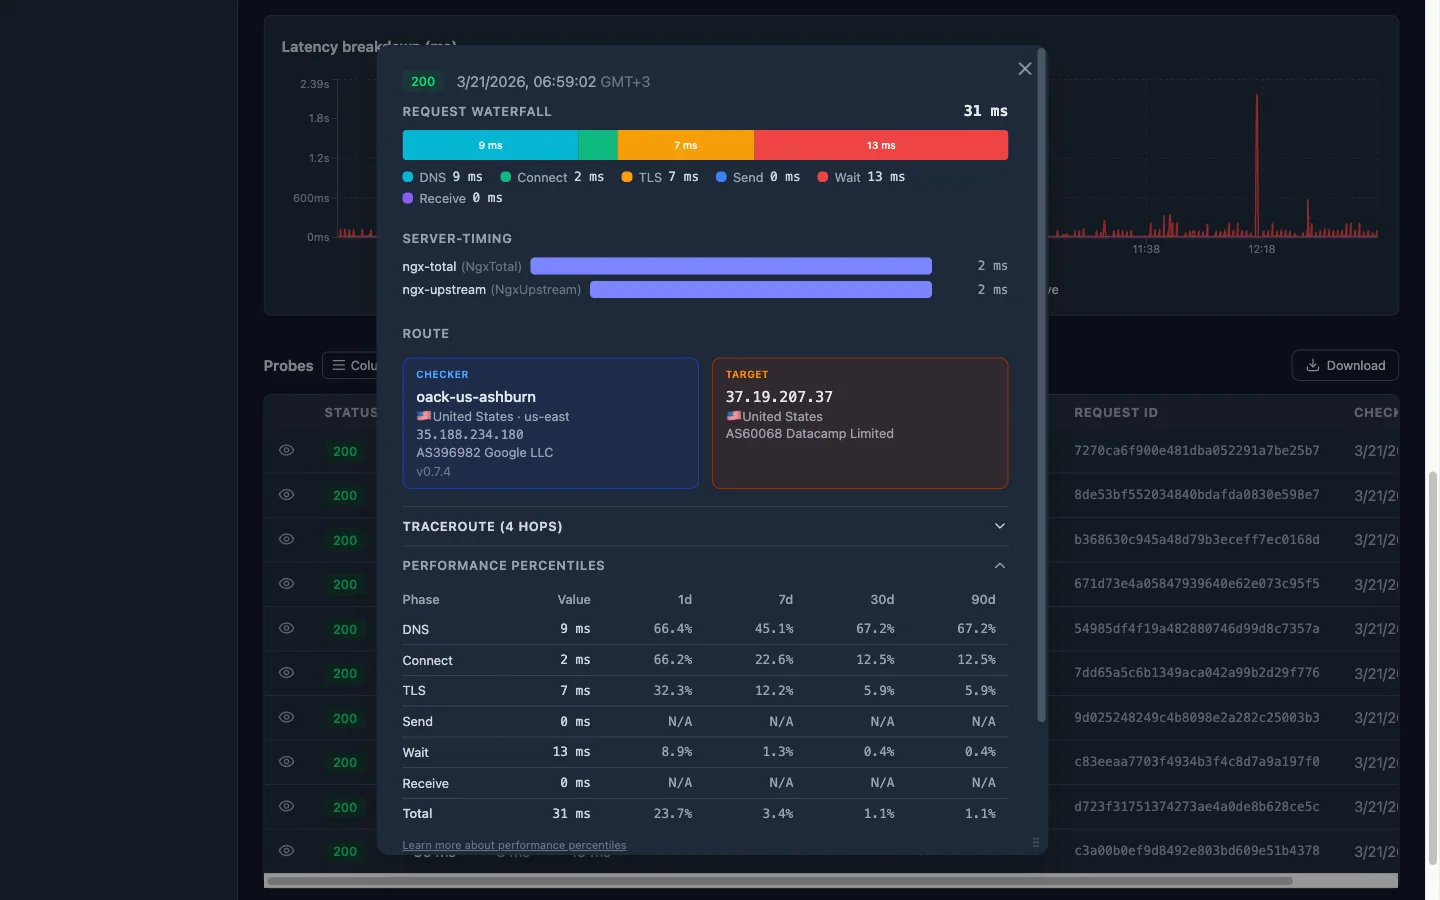
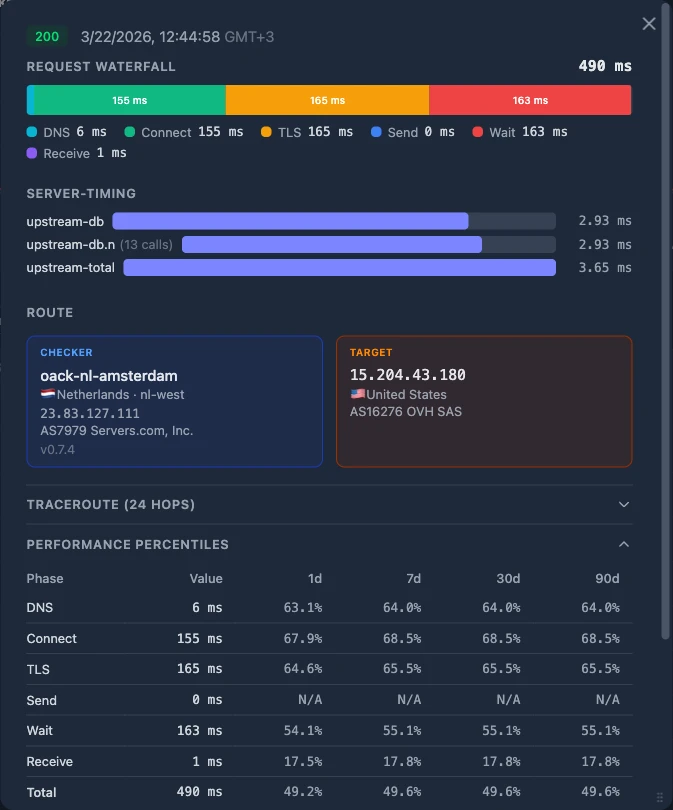
Oack’s probe detail page shows Performance Percentiles for every timing fraction. For each phase, you see the current value and its percentile rank across four time windows: 1-day, 7-day, 30-day, and 90-day. The rank tells you what percentage of historical probes had a lower value — in other words, how unusual this result is.
Here’s a real example:
| Phase | Value | 1d | 7d | 30d | 90d |
|---|---|---|---|---|---|
| DNS | 2 ms | 61.8% | 41.1% | 41.1% | 41.1% |
| Connect | 0 ms | N/A | N/A | N/A | N/A |
| TLS | 1357 ms | 95.5% | 95.4% | 95.4% | 95.4% |
| Send | 0 ms | N/A | N/A | N/A | N/A |
| Wait | 10510 ms | 84.8% | 84.7% | 84.7% | 84.7% |
| Receive | 0 ms | N/A | N/A | N/A | N/A |
| Total | 11869 ms | 90.7% | 93.4% | 93.4% | 93.4% |
How to read this: a rank of 95.4% on TLS means that 95.4% of probes over the last 7 days had a faster TLS handshake — this value is near the top of the distribution, which is a clear anomaly. N/A means the value is zero and there’s no meaningful distribution to rank against.
In this example, the TLS phase jumps out immediately: 1357 ms at the 95th percentile across all windows. The Wait phase is also elevated at ~85th percentile with over 10 seconds. Meanwhile, DNS is unremarkable at ~41st percentile. This tells you the bottleneck involves the TLS negotiation and server processing time — not DNS or the network path itself.
The rule of thumb: if a phase ranks below ~70%, it’s within normal range — don’t chase it. If it’s above ~90%, something changed. Focus there. Consistent ranks across all four windows (like the 95.4% on TLS here) suggest a structural issue, not a transient spike.
Step 2: Cross-reference with TCP metrics
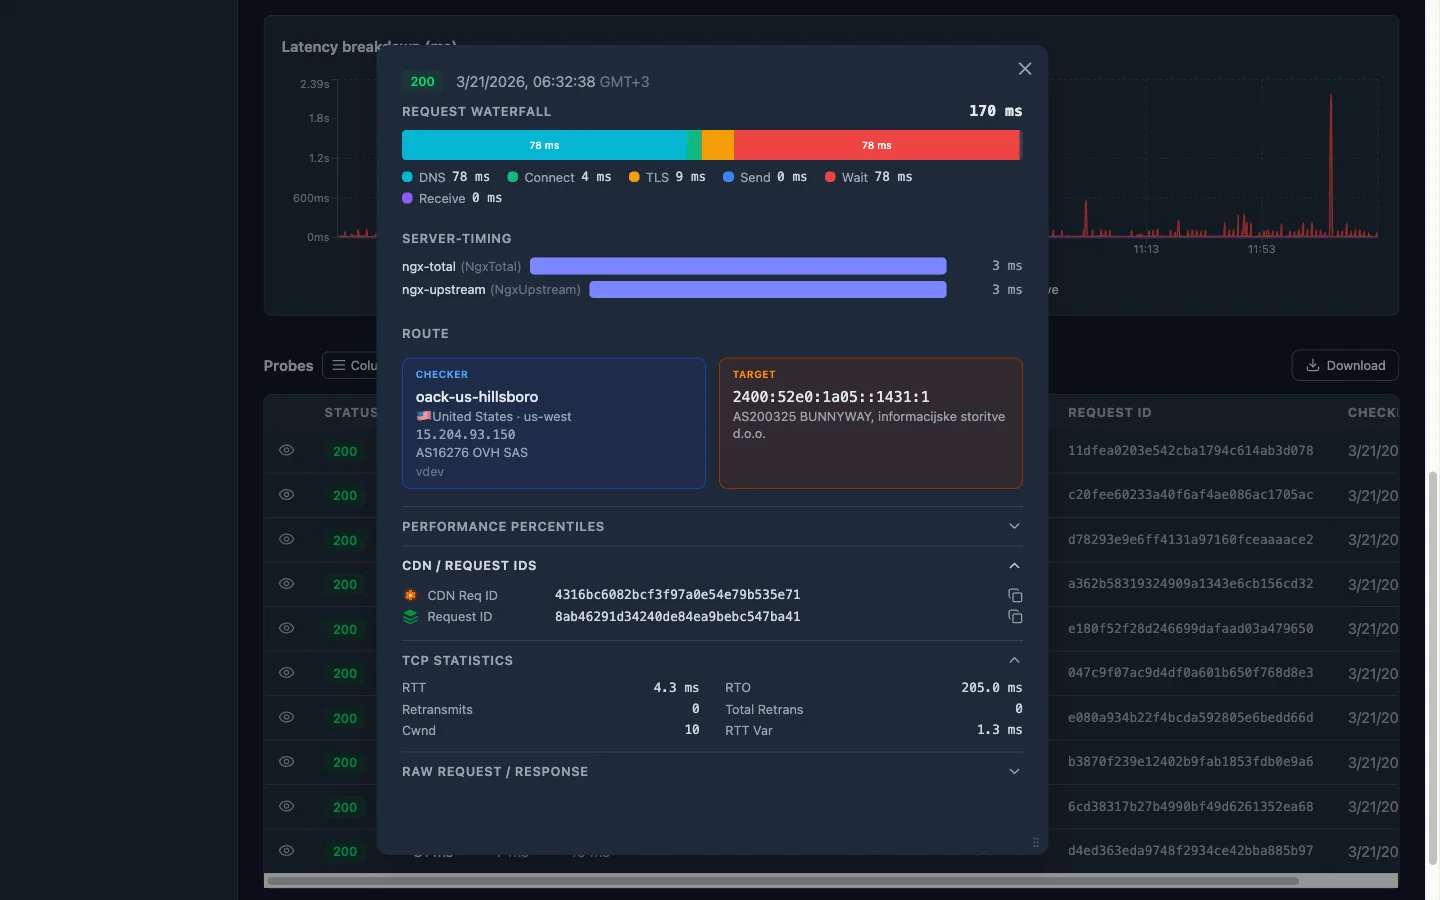
HTTP timing fractions tell you what’s slow. TCP metrics tell you why.
RTT vs. wait time
Compare the kernel-reported RTT with the wait_ms fraction:
- RTT ~ 10 ms, wait_ms ~ 850 ms — The network path is fast. The 840 ms gap is pure server processing time (or CDN origin-fetch time). The problem is behind the load balancer.
- RTT ~ 800 ms, wait_ms ~ 850 ms — The network itself is slow. The server responded almost instantly, but the round trip ate all the time. Look at routing, geographic distance, or packet loss.
Congestion window (cwnd)
A healthy connection has a congestion window that grows over time. If you see cwnd stuck at a low value (e.g. 2–4 segments), the kernel is throttling sends because it detected loss. This often correlates with:
- High
retransmitscount - Elevated
rto(retransmission timeout) - A
receive_msthat’s disproportionately large compared to the response size
A collapsed congestion window with zero retransmits can indicate an MTU/path-MTU issue — the segments are being silently dropped somewhere along the path.
Retransmits
Even a single retransmit adds a full RTO (often 200 ms+) of delay. If the retransmit counter is non-zero and wait_ms or receive_ms spiked, you’ve likely found your culprit. Retransmits point to packet loss — which could be on the last mile, in a congested peering link, or at a rate-limited intermediary.
Step 3: Read the server-side headers
If TCP metrics look healthy (low RTT, zero retransmits, growing cwnd), the problem is above the transport layer. Now check what the server-side headers report.
Origin timing looks good, client timing is bad
This is the most interesting case. You see:
Server-Timing: upstream;dur=45— the origin processed the request in 45 ms- Nginx log shows
$request_timeof 60 ms — the load balancer’s total handling time was 60 ms - But on the client side,
wait_msis 850 ms
The origin and load balancer say everything was fast. The client says it waited 850 ms. Where did the other 790 ms go?
Check client-side fractions first:
| Fraction | Value | Verdict |
|---|---|---|
dns_ms | 2 ms | Not here |
connect_ms | 8 ms | Not here |
tls_ms | 15 ms | Not here |
DNS, TCP handshake, and TLS are all small. The network path to the edge is fine.
The CDN edge is the hot spot. If the origin is fast, the client network is fast, and the total is slow — the time is being spent at the CDN layer. Common causes:
- Cache MISS with slow origin fetch — the CDN had to go back to origin, and the path between CDN edge and origin is slow (different from the path between client and CDN edge)
- CDN edge compute — WAF rules, bot detection, or edge functions adding latency
- CDN connection reuse failure — the edge had to establish a new TLS connection to origin instead of reusing a pooled one
- Geographic routing issue — the CDN routed the request to a distant edge PoP instead of the nearest one (check the CDN geo data that Oack enriches on every probe)
Look at the cf-cache-status header (or equivalent for your CDN). A HIT with low total time vs. a MISS with high total time tells the story immediately. If it’s a MISS, the CDN had to fetch from origin — and the CDN-to-origin path may be very different from the client-to-CDN path.
Step 4: The decision tree
Putting it all together, here’s the systematic path:
1. Is wait_ms above its P95? If no — the latency is within normal range. Check other fractions or look at receive_ms for large-payload issues.
2. Is RTT high relative to wait_ms? If RTT accounts for most of wait_ms, the problem is the network path — check geographic distance, BGP routing, or packet loss via retransmits.
3. Are retransmits > 0 or cwnd collapsed? If yes, packet loss is the bottleneck. This can be last-mile, ISP peering, or an MTU issue.
4. Does the origin report fast response times? Check Server-Timing, x-upstream-time, or access logs. If origin says it was fast:
5. Are client-side fractions (dns, connect, tls) small? If yes — the client-to-edge path is healthy, the origin is healthy, so the CDN edge is the hot spot. Check cache status, edge PoP location, and CDN-to-origin connectivity.
6. Is a client-side fraction elevated? If dns_ms spiked, it’s a resolver issue. If connect_ms spiked, it’s a routing or TCP-level issue to the edge. If tls_ms spiked, check for certificate chain issues or session resumption failures.
Start here
Every probe in Oack already captures all of these signals — HTTP timing fractions with percentile context, TCP kernel metrics, and response header extraction. Open any probe detail page, expand the Performance Percentiles section, and start with the question: which fraction is outside its normal range?
The answer narrows your investigation from “something is slow” to a specific layer and a specific hypothesis — which is the difference between a 10-minute diagnosis and an all-day war room.
Let an AI agent do the digging
The systematic approach above works well when you’re doing it manually. But correlating percentile ranks, TCP metrics, and server-side headers across dozens of probes is exactly the kind of work that AI coding agents excel at — sifting through large volumes of data and finding patterns that would take you much longer to spot by hand.
Oack’s MCP server gives your agent direct access to all the same data: probe history, latency breakdowns, TCP statistics, and performance percentiles. You can ask it “why is this monitor slow?” and it will walk through the decision tree from this article programmatically — checking which fractions are anomalous, cross-referencing RTT with wait time, and reading server-side headers — then report back with a root cause and a suggested fix.
Start monitoring with Oack
Get TCP telemetry, 5-second alerts, and global coverage — free to start.
Get started free